

Amazon Profitability in 2026: Why Revenue Tracking Is No Longer Enough
In short
Why revenue tracking is no longer enough for Amazon sellers in 2026, and how true profit analysis with tools like sellerboard helps you protect your margin.
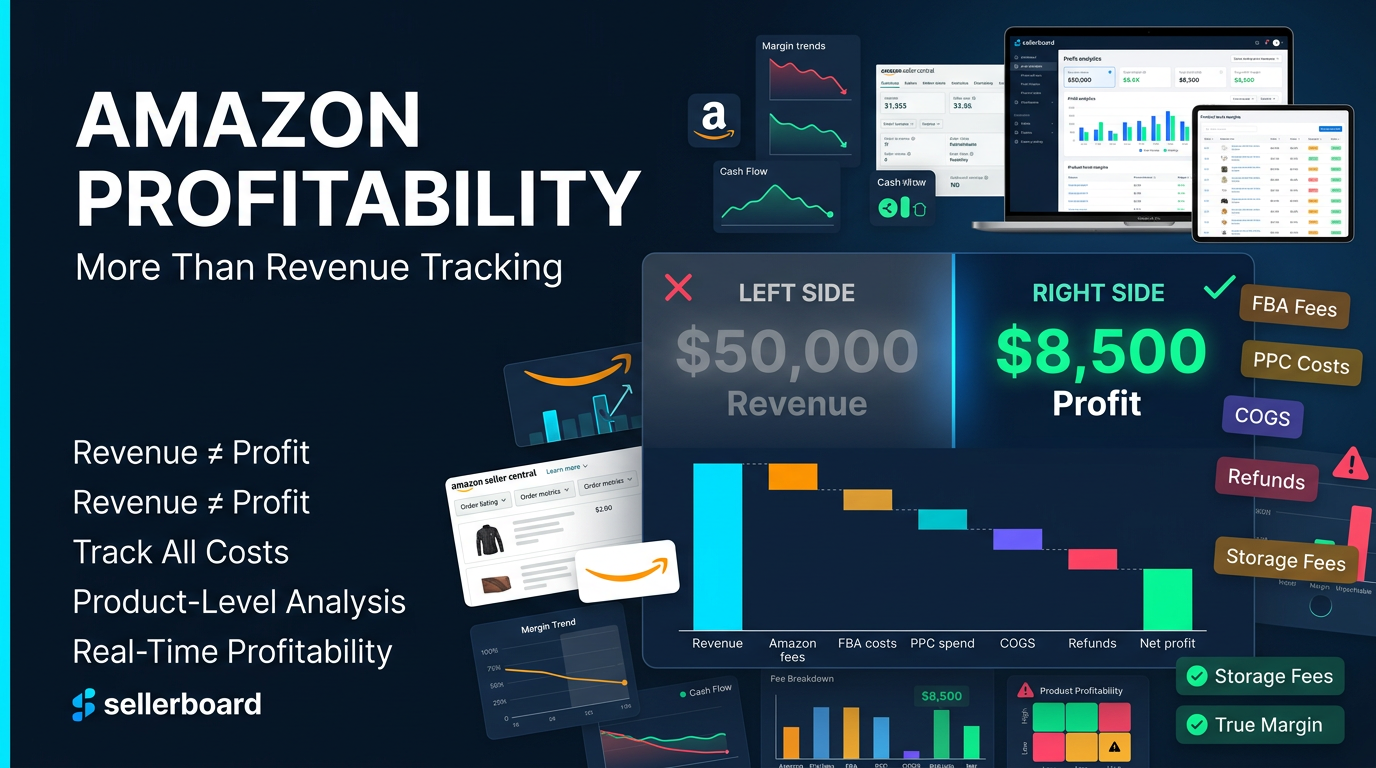
Selling on Amazon has never been simple, but in 2026 profitability has become more volatile than ever. For years, many sellers treated revenue as the main signal of success: if sales grew, the business looked healthy. That logic no longer holds. A product can post strong sales and still lose money, a campaign can lift order volume while quietly eating your margin, and a business can look like it is scaling while cash flow tightens every month. This is the bigger picture we cover in our overview of AI for e-commerce; here we focus on the financial discipline that keeps an Amazon business alive.
Contents
- Revenue is not profit
- Why 2026 makes profit tracking harder
- What good profit analysis should show
- How sellerboard reveals true profit
- Dynamic COGS and accurate history
- Refunds, advertising, and inventory
- The bottom line
Revenue is not profit
Revenue is easy to see and easy to misread. A product doing €50,000 a month in sales looks like a winner on the top line. But that number says nothing about referral fees, fulfillment fees, storage, advertising, refunds, cost of goods, inbound shipping, duties, taxes, software, and the dozen other costs sitting underneath it. Once those are included, the picture often changes completely.
A high-revenue product can have thin or negative margins because ad spend is too high. A quieter product can be your strongest profit contributor because it carries lower fees and fewer returns. A promotion can generate an impressive spike in orders and leave almost nothing behind. This is why revenue-based decisions are dangerous: the question is not “how much did we sell,” but “how much did we actually keep.”
Why 2026 makes profit tracking harder
The marketplace in 2026 is defined by moving costs. Amazon raised US FBA fulfillment fees again in January, and an additional fuel and logistics surcharge took effect in April, layering on top of an already tight cost structure. Tariffs and shifting supplier prices push landed costs up, freight and currency rates move, and advertising keeps getting more expensive as competition intensifies.
The practical consequence is that margins shift fast. A product that was profitable six months ago may not be today. A campaign that worked last quarter may now be too expensive. A restock that looked safe under old cost assumptions may no longer make sense after a freight or duty change. Static spreadsheets struggle here. They work when a business is small and costs are stable, but when fees, exchange rates, refunds, and ad performance all move at once, manual tracking becomes slow and error-prone. By the time the spreadsheet is updated, the business has already moved on.
What good profit analysis should show
A proper profit process answers a handful of practical questions. It should show true net profit, not gross sales, with every relevant cost deducted. It should show profitability by product, because account-level numbers hide which specific SKUs are carrying the business and which are quietly draining it. It should track changes over time, so you can see whether margin is improving or eroding rather than relying on a single daily snapshot. And it should lead to action, because profit data is only useful if it changes what you do next: prices, bids, reorders, listings, refund investigations, reimbursement claims.
That last point is the line between reporting and intelligence. Reporting tells you what happened. Profit intelligence helps you decide what to do about it.
How sellerboard reveals true profit
sellerboard is built specifically for this problem. Its profit dashboard shows performance at both account and product level, with true net profit after Amazon fees, advertising, refunds, COGS, and indirect expenses are included. That matters because profit problems usually hide inside the details: a product can look strong in Seller Central because revenue is climbing, while the same product is barely breaking even once ad spend, fees, and returns are counted.
The platform also lets you view performance from several angles rather than forcing one summary. A quick daily overview tells you whether the business is on track; a trend view reveals structural issues building over months; a detailed profit-and-loss view supports deeper financial review; product-level views guide pricing, PPC, and inventory. Different decisions need different perspectives, and no single screen tells the whole story.
Dynamic COGS and accurate history
Cost of goods is one of the most important inputs in Amazon profit analysis and one of the easiest to get wrong. Few sellers have a single fixed product cost; they buy in batches, each with its own manufacturing cost, freight, duties, and exchange rate. If those changes are not reflected, profit numbers quietly drift away from reality.
sellerboard supports dynamic COGS with batch and FIFO logic, applying the cost of your oldest stock to your earliest sales and working through batches chronologically. It also recalculates history when you correct cost data, so old reports do not keep showing distorted margins. This is not just an accounting nicety: underestimate COGS and you will think a losing product is profitable; overestimate it and you may cut a product that is actually working.
Refunds, advertising, and inventory
Three other areas quietly decide profitability. Refunds are rarely as simple as “lost revenue”: they involve refundable and non-refundable fees, return shipping, lost COGS, and sometimes unsellable inventory. Modeling that real cost turns returns from background noise into a signal, often pointing to a listing, sizing, or packaging issue you can fix.
Advertising is where many sellers slip. ACoS alone does not show whether a campaign is profitable for a product’s actual margin. By folding PPC spend directly into profit analysis, sellerboard shows product-level profit after ads, so you can scale what is profitable instead of what merely looks busy. And inventory ties it all together: stockouts cost rank and revenue, overstock locks up cash and storage. Forecasting and restock alerts help you reorder based on profit and velocity, not gut feel.
Beyond analytics, operational tools protect margin in real time: rules-based PPC automation, TOS-compliant customer messaging, reimbursement detection for Amazon errors, and alerts for suppressed listings, hijackers, and buy box issues. Profit is not only calculated after the fact; it is defended through daily operations.
The bottom line
Amazon selling in 2026 demands more financial discipline than ever. Rising fees, tariffs, fluctuating logistics, and growing ad pressure mean margins move quickly, and sellers who rely on revenue reports or static spreadsheets are deciding on incomplete, outdated information. Real profitability needs account- and product-level visibility, accurate FIFO-based COGS, refund modeling, profit-adjusted advertising, inventory forecasting, and reimbursement monitoring in one place.
If you want to see what you actually keep after every cost, it is worth testing this on your own numbers. Through our link you get two months of sellerboard free instead of the standard one-month trial, which is more than enough time to see your true margins before committing.
Want help setting up profit-driven decision making for your Amazon business? Get in touch with us.
Related articles
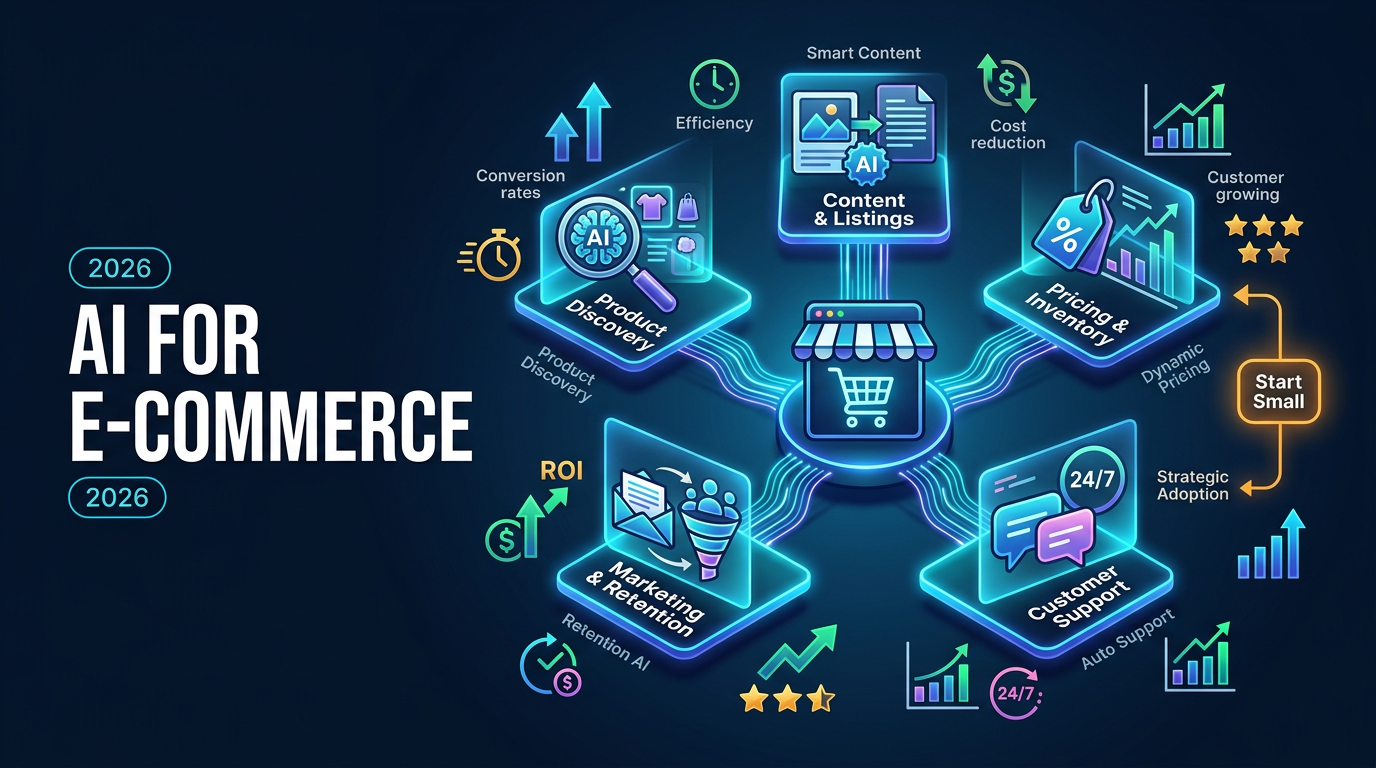
AI for E-Commerce in 2026: Where It Actually Helps and How to Start
AI for e-commerce in 2026: a practical overview of where AI genuinely helps online stores, from product discovery to operations, and how to adopt it without chasing every trend.

AI Influencers for E-Commerce Brands in 2026: A Virtual Ambassador for Your Products
AI influencers for e-commerce brands in 2026: how a virtual brand ambassador showcases products around the clock, cuts photoshoot costs, and drives social commerce.

AI Product Research for E-Commerce in 2026: From Idea to Listing
AI product research for e-commerce in 2026: how to go from idea to validated product to ready listing faster, where AI genuinely helps, and where human judgment still wins.